Mathematica 10
Statistical Distribution Examples

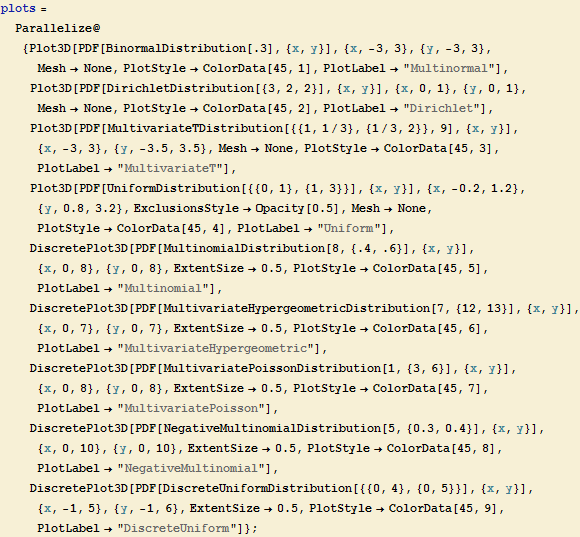
Multivariate continuous and discrete parametric distributions.

index_1.gif

index_2.gif

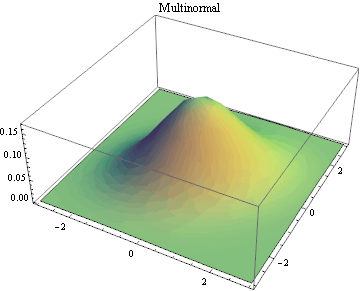
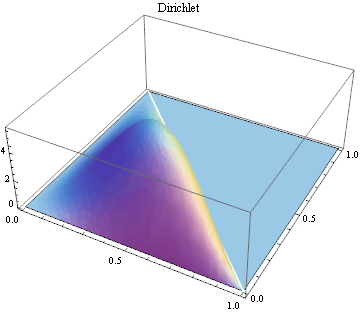
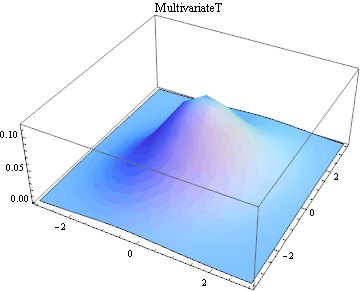
Graphics:Multinormal Graphics:Dirichlet Graphics:MultivariateT
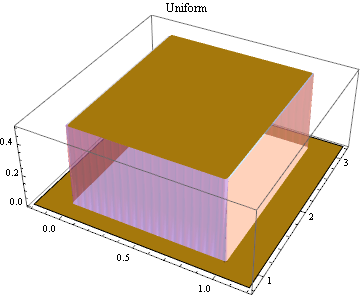
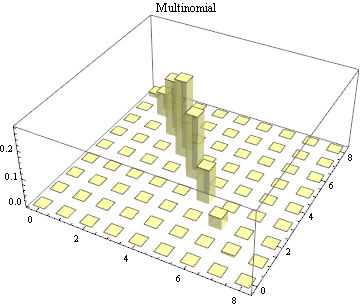
Graphics:Uniform Graphics:Multinomial Graphics:MultivariateHypergeometric
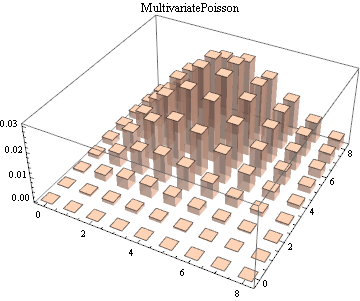
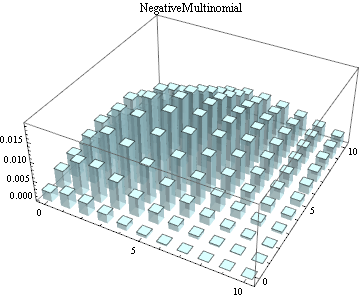
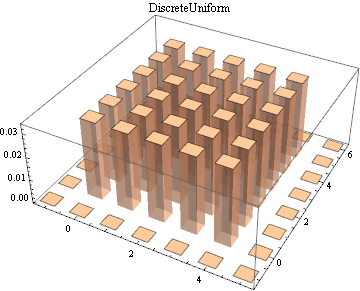
Graphics:MultivariatePoisson Graphics:NegativeMultinomial Graphics:DiscreteUniform

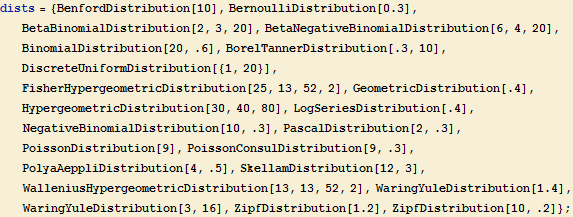
Discrete univariate parametric distributions
index_12.gif

index_13.gif

index_14.gif

index_15.gif

index_16.gif index_17.gif index_18.gif index_19.gif
index_20.gif index_21.gif index_22.gif index_23.gif
index_24.gif index_25.gif index_26.gif index_27.gif
index_28.gif index_29.gif index_30.gif index_31.gif
index_32.gif index_33.gif index_34.gif index_35.gif
index_36.gif index_37.gif

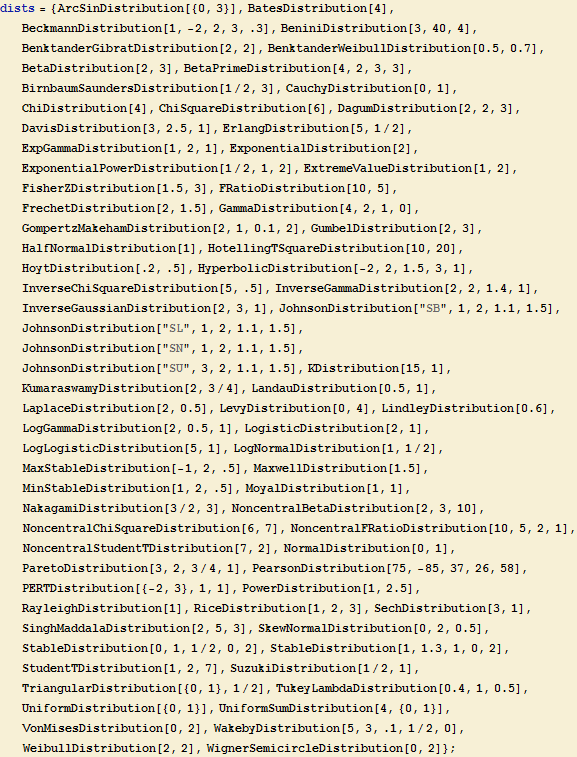
Univariate continuous parametric distributions
index_38.gif

index_39.gif

index_40.gif

index_41.gif

index_42.gif index_43.gif index_44.gif index_45.gif index_46.gif index_47.gif
index_48.gif index_49.gif index_50.gif index_51.gif index_52.gif index_53.gif
index_54.gif index_55.gif index_56.gif index_57.gif index_58.gif index_59.gif
index_60.gif index_61.gif index_62.gif index_63.gif index_64.gif index_65.gif
index_66.gif index_67.gif index_68.gif index_69.gif index_70.gif index_71.gif
index_72.gif index_73.gif index_74.gif index_75.gif index_76.gif index_77.gif
index_78.gif index_79.gif index_80.gif index_81.gif index_82.gif index_83.gif
index_84.gif index_85.gif index_86.gif index_87.gif index_88.gif index_89.gif
index_90.gif index_91.gif index_92.gif index_93.gif index_94.gif index_95.gif
index_96.gif index_97.gif index_98.gif index_99.gif index_100.gif index_101.gif
index_102.gif index_103.gif index_104.gif index_105.gif index_106.gif index_107.gif
index_108.gif index_109.gif index_110.gif index_111.gif index_112.gif index_113.gif
index_114.gif index_115.gif index_116.gif index_117.gif index_118.gif

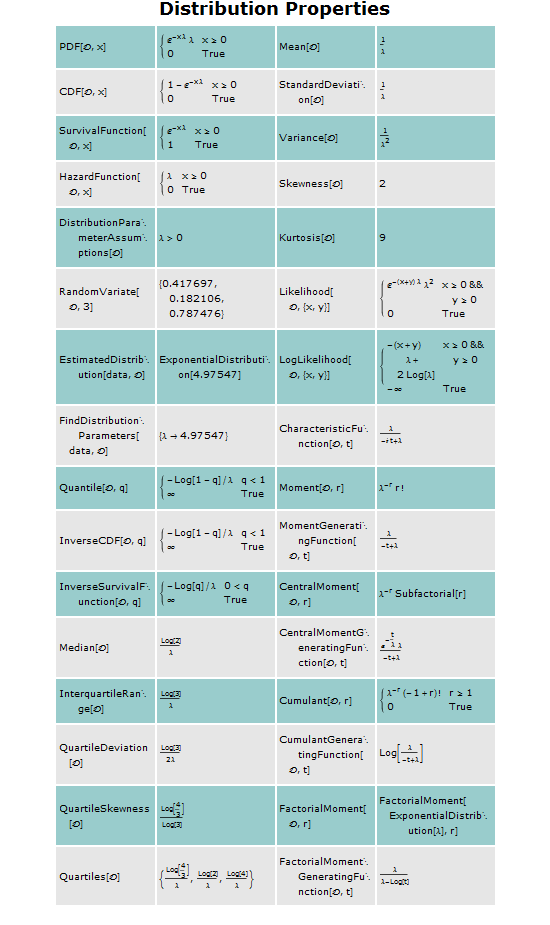
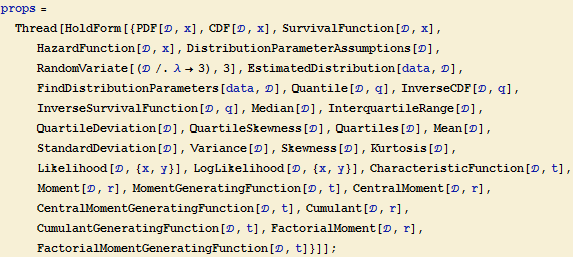
An extensive list of properties can be queried for each supported distribution
index_119.gif

index_120.gif

index_121.gif

index_122.gif

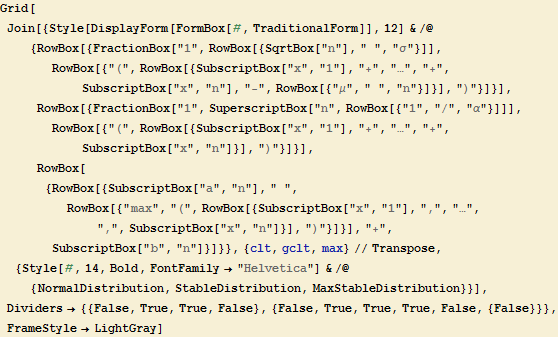
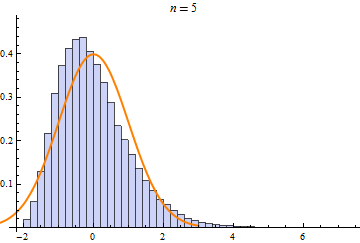
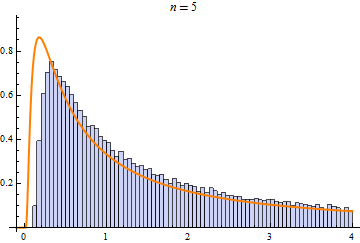
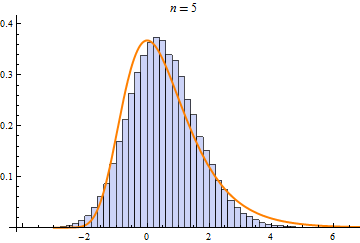
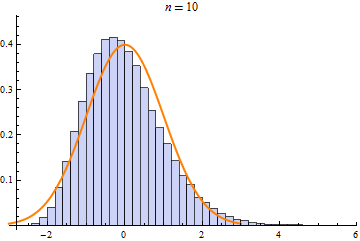
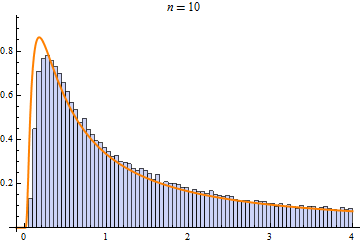
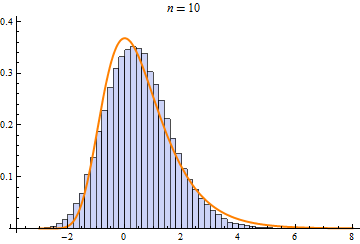
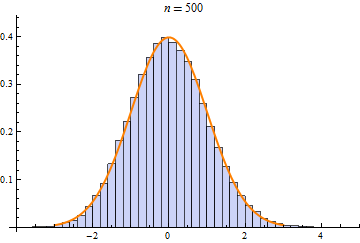
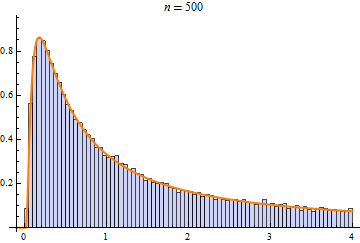
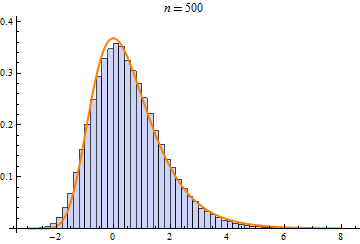
Some operations, such as sum, min, or max of random variables, converge to only a few limit distributions when repeated. These limit distributions include NormalDistribution, StableDistribution, MinStableDistribution, and MaxStableDistribution

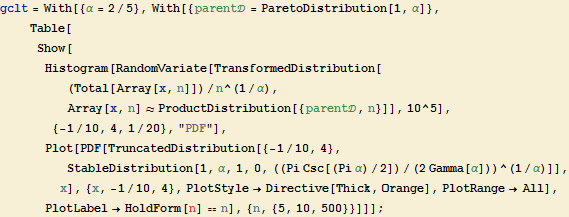
index_123.gif

index_124.gif

index_125.gif

index_126.gif

index_127.gif index_128.gif index_129.gif
Graphics:n5 Graphics:n5 Graphics:n5
Graphics:n10 Graphics:n10 Graphics:n10
Graphics:n500 Graphics:n500 Graphics:n500
NormalDistribution StableDistribution MaxStableDistribution

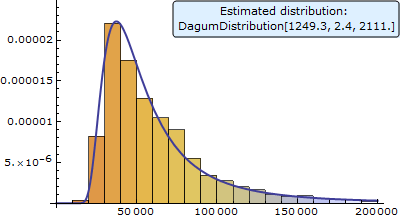
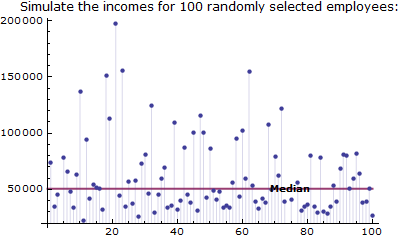
Simulate Incomes with Dagum Distribution

index_139.gif

index_140.gif

index_141.gif

Graphics:Simulate the incomes for 100 randomly selected employees:

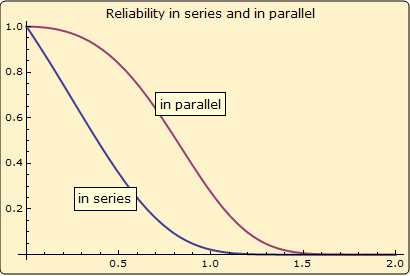
Model a lifetime of a device by a GompertzMakehamDistribution and compare reliability of systems composed of two such devices put in series or in parallel.

index_143.gif

index_144.gif

index_145.gif

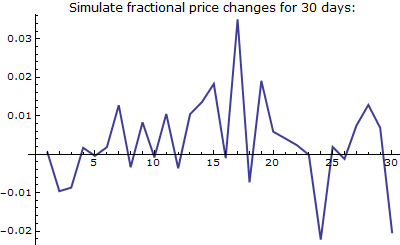
Use Logistic Distribution to Simulate Fractional Change
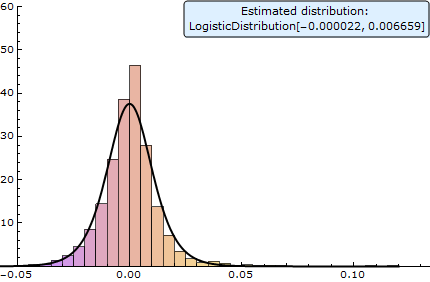
LogisticDistribution provides a very good fit for fractional price changes from the previous closing price of stocks. Use EstimatedDistribution to find best fit with logistic distribution for the daily fractional price changes of Standard & Poor’s 500 index from January 1, 2000 to January 1, 2009. Then use this distribution to run a simulation.

index_146.gif

index_147.gif

index_148.gif

index_149.gif

Graphics:Simulate fractional price changes for 30 days:

More various examples

index_151.gif

index_152.gif

index_153.gif

index_154.gif

index_155.gif

index_156.gif

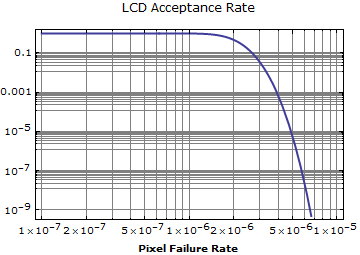
Graphics:LCD Acceptance Rate

index_158.gif

index_159.gif

index_160.gif

index_161.gif

Gauss Normal distribution

index_162.gif

index_163.gif

index_164.gif

index_165.gif

Student distribution

index_166.gif

index_167.gif

index_168.gif

index_169.gif

index_170.gif

index_171.gif

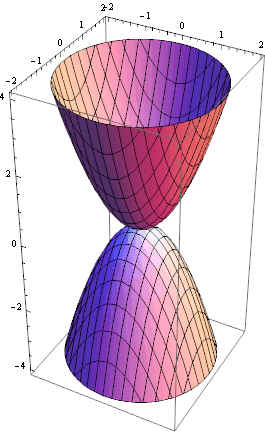
Examples of 3D-Plotting

index_172.gif

index_173.gif

index_174.gif

index_175.gif

index_176.gif

index_177.gif

index_178.gif

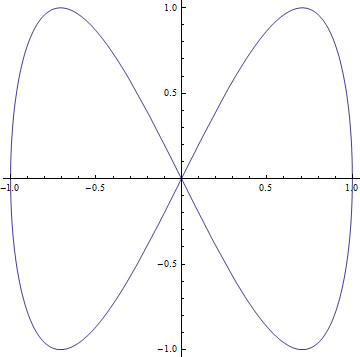
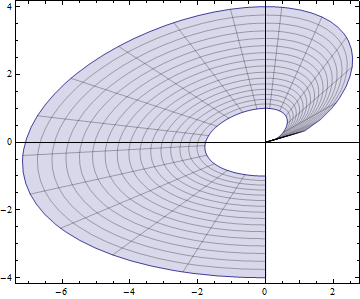
Parametric Plotting

index_179.gif

index_180.gif

index_181.gif

index_182.gif

index_183.gif

index_184.gif

index_185.gif

index_186.gif

index_187.gif

index_188.gif

index_189.gif

index_190.gif

index_191.gif

index_192.gif

index_193.gif

index_194.gif

index_195.gif

index_196.gif

index_197.gif

index_198.gif

index_199.gif

index_200.gif

index_201.gif

index_202.gif

index_203.gif

index_204.gif

index_205.gif

index_206.gif

index_207.gif

index_208.gif

index_209.gif

index_210.gif

index_211.gif

index_212.gif

index_213.gif

index_214.gif

Parametric 3D-Plotting

index_215.gif

index_216.gif

index_217.gif

index_218.gif

index_219.gif

index_220.gif

index_221.gif

index_222.gif

index_223.gif

index_224.gif

index_225.gif

index_226.gif

index_227.gif

index_228.gif


For more information and examples visit   http://www.wolfram.com

For how to learn and teach math see the video with Conrad Wolfram Talk at
Wolfram Technology Conference 2010:

http://www.computerbasedmath.org/resources/reforming-math-curriculum-with-computers.html